
Crystal Insights Blog

Your go-to resource for market trends, technical price actions, risk strategies, and expert trading advice.

Has Nifty Really Bottomed Out? Key Levels, Nifty IT Rally & Market Risks Cover Market Strategy
16 Oct, 2026 • 6 min read
Has Nifty Really Bottomed Out? Key Levels, Nifty IT Rally & Market Risks

Nifty has recovered nearly 1,000 points from its recent lows, supported by a strong rally in IT stocks. However, with Nifty approaching 23,050–23,200 resistance and Nifty IT nearing 32,000, is this a genuine market reversal or a temporary relief rally? Explore the technical outlook, global risks and levels investors should watch.

Nifty After a Sharp Correction: Can Extreme Fear Trigger a Relief Bounce? Cover Market Strategy
16 Sep, 2026 • 5 min read
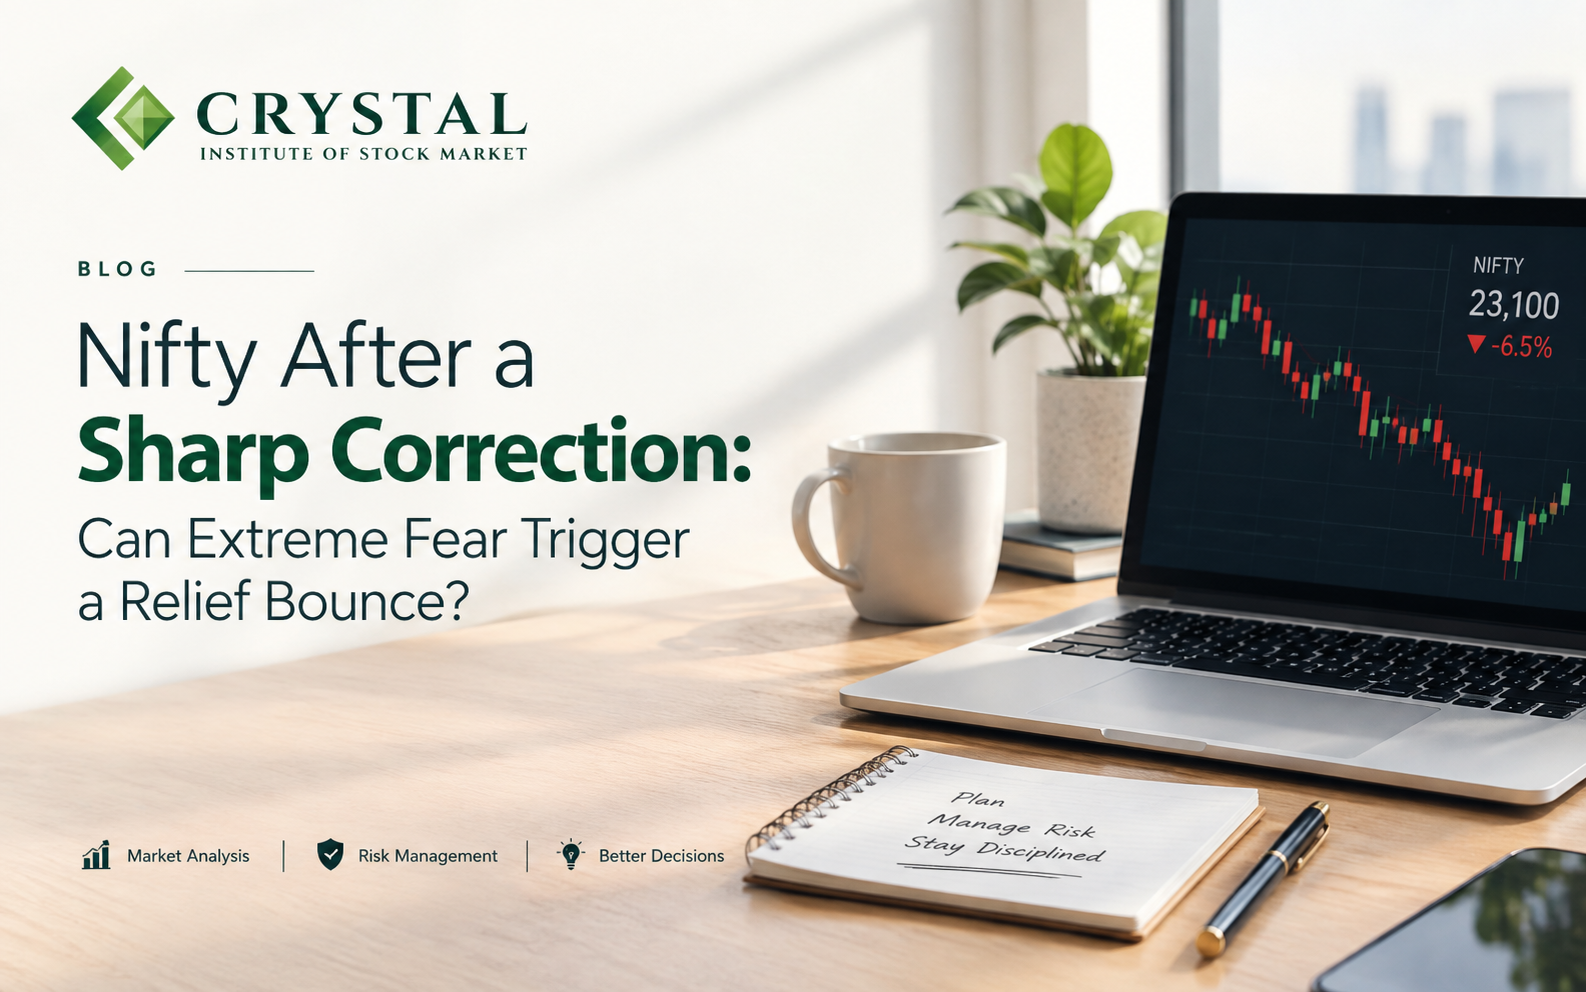
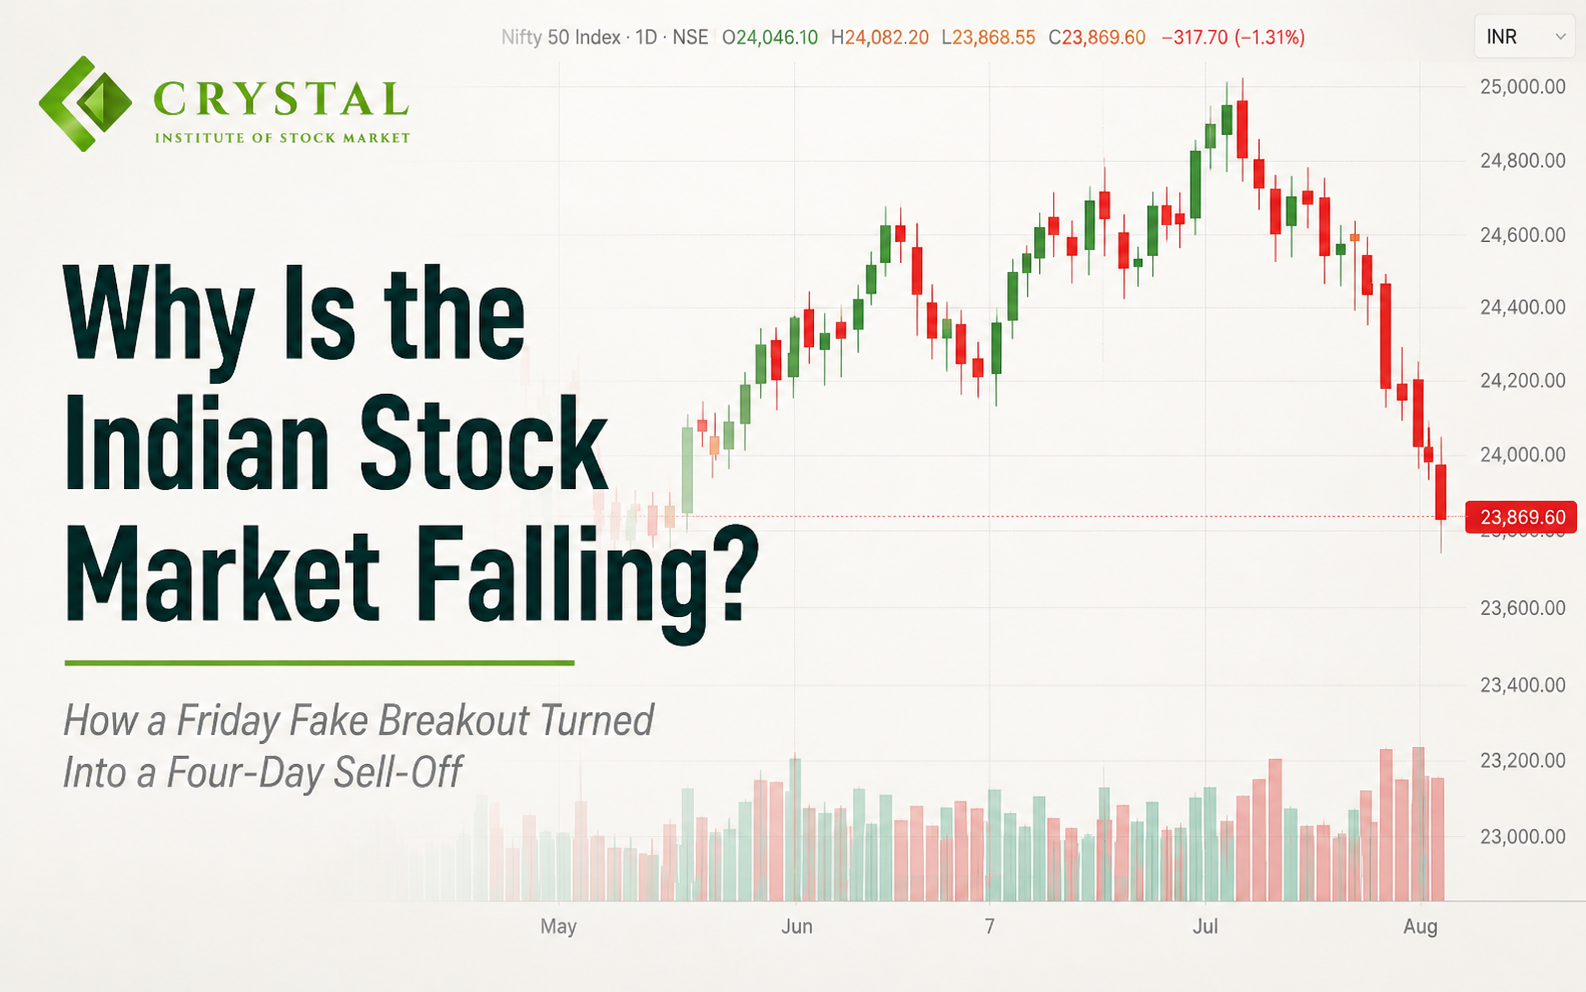
Nifty After a Sharp Correction: Can Extreme Fear Trigger a Relief Bounce?

Nifty has corrected sharply from around 24,700 to near 23,100, while market sentiment has moved into extreme fear. With the index approaching an important support zone and the Fed interest-rate decision in focus, could the market see a relief bounce? Here’s what investors should watch before assuming the correction is over.

July 2026 Market Wrap & August Outlook: Can Nifty Break Above 24,550? Cover Market Strategy
01 Aug, 2026 • 7 min read
July 2026 Market Wrap & August Outlook: Can Nifty Break Above 24,550?

The Indian stock market staged a strong comeback in the final week of July, with Nifty gaining over 2.5% after taking support near 23,600. Strong FII and DII buying, easing crude oil prices, and leadership from IT and Pharma stocks helped improve sentiment. Here's a complete review of the week's action and what traders should watch in the first week of August.

How to Read Candlestick Charts: A Beginner's Step-by-Step Guide (2026) Cover Trading Basics
25 Jul, 2026 • 7 min read
How to Read Candlestick Charts: A Beginner's Step-by-Step Guide (2026)

Candlestick charts are one of the most widely used tools in technical analysis. Whether you're an investor or a trader, understanding how to read candlestick charts can help you interpret market sentiment and make more informed decisions. This beginner-friendly guide explains candlesticks in simple language with practical examples.

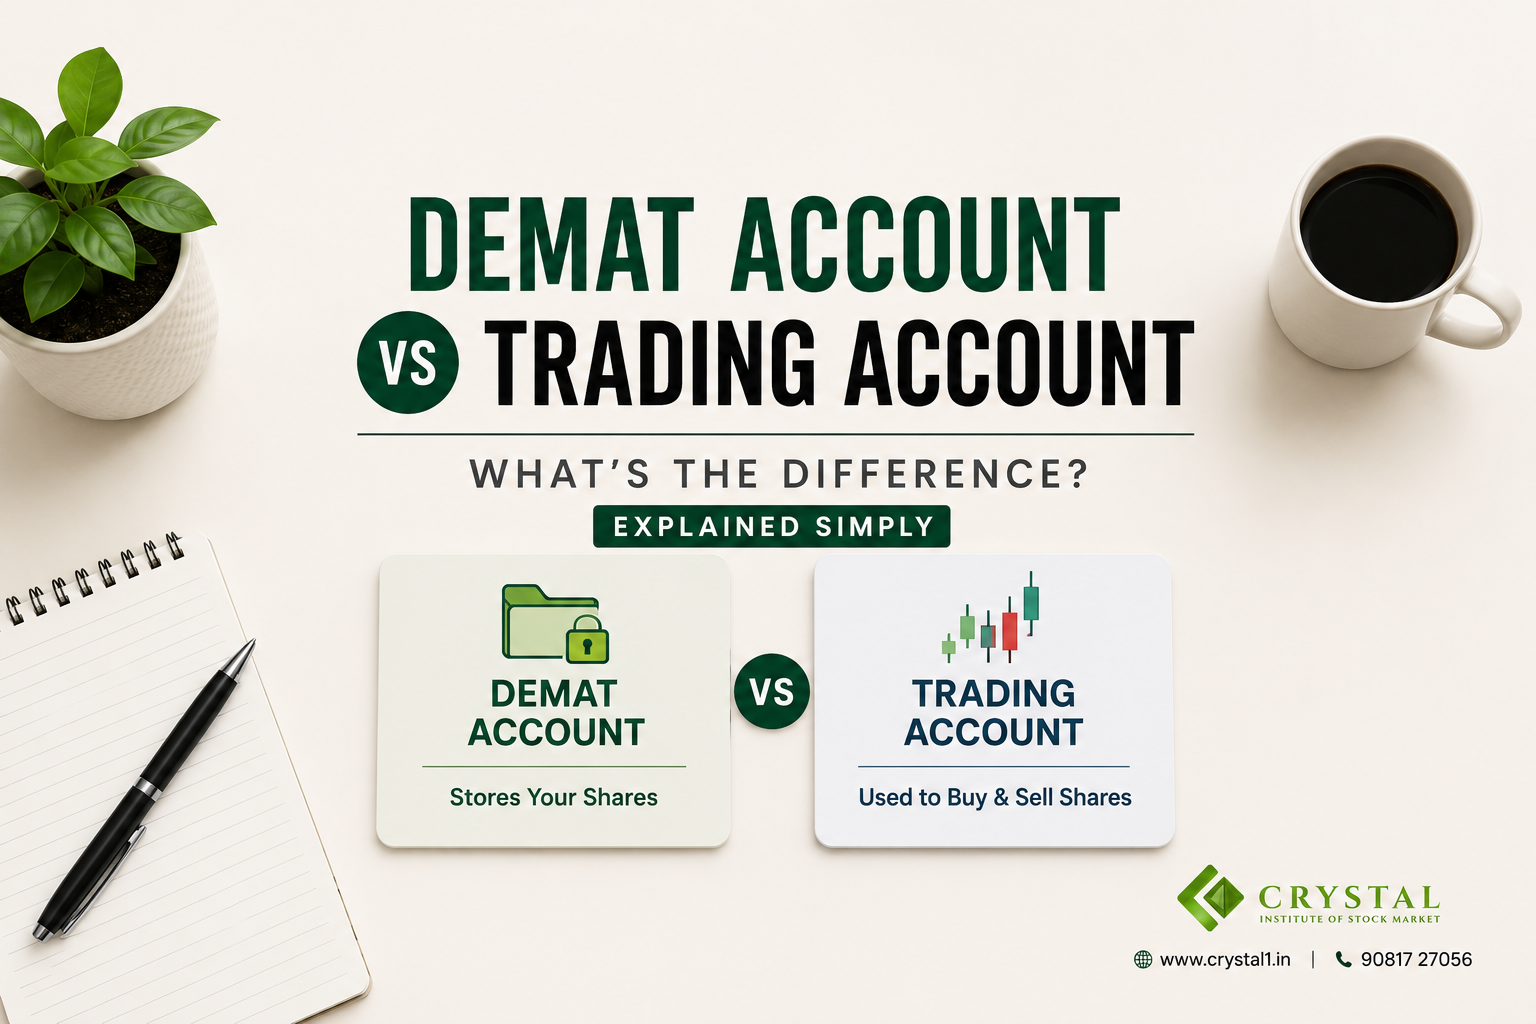
Demat Account vs Trading Account: What's the Difference? (Explained Simply) Cover Trading Basics
25 Jul, 2026 • 5 min read
Demat Account vs Trading Account: What's the Difference? (Explained Simply)

If you're new to the stock market, you've probably heard about Demat and Trading accounts. Many beginners think they're the same, but they serve completely different purposes. In this guide, we'll explain the difference between a Demat Account and a Trading Account in simple language, helping you understand why both are essential before you start investing or trading in the Indian stock market.