

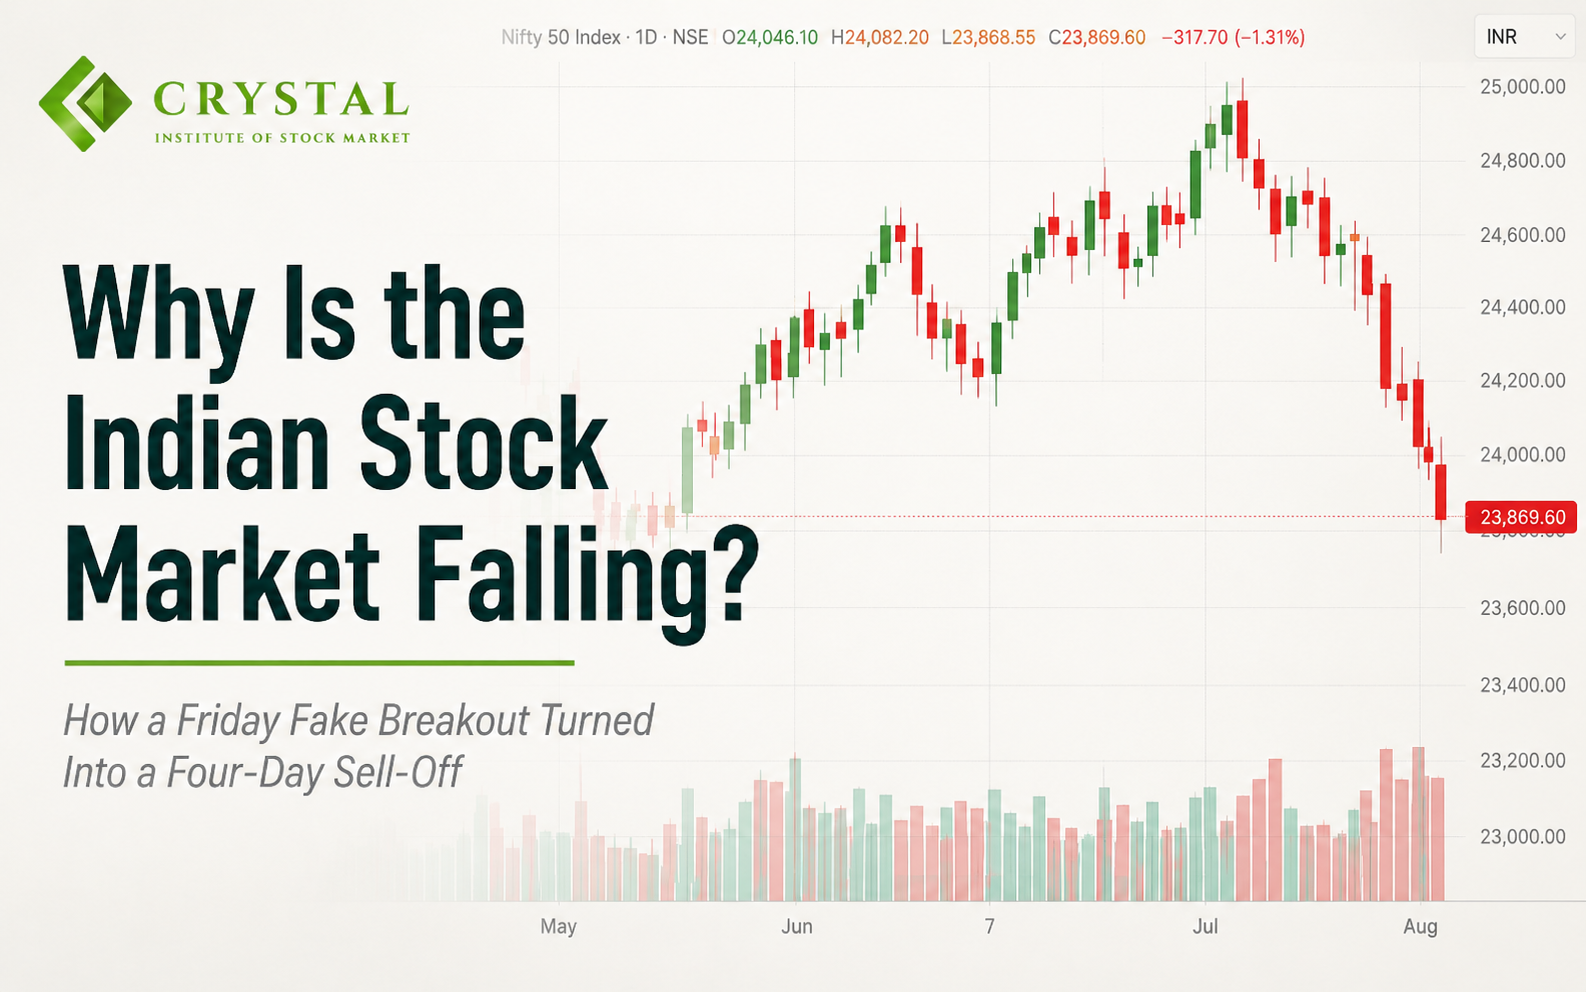
Nifty's Failed Breakout, Banking Weakness, Rising Crude Oil & Global Cues Explained
The Indian stock market has been under continuous selling pressure since Monday, leaving many traders and investors wondering:
Why is the Indian stock market falling?
Interestingly, the weakness didn't begin on Monday—it actually started with a failed breakout on Friday.
After successfully breaking above a crucial resistance zone, Nifty looked ready for a fresh rally. Market sentiment turned positive, and many traders expected the index to continue its upward momentum. However, the breakout failed to sustain, and the optimism quickly turned into disappointment.
A combination of mixed banking earnings, a sharp fall in Bank Nifty led by HDFC Bank, rising crude oil prices, weak global markets, and technical breakdowns transformed what looked like a bullish breakout into a four-day sell-off.
Let's understand what exactly happened.
Market Snapshot (23 July 2026)
| Market | Close | Change |
|---|---|---|
| Sensex | 76,391 | -363 Points |
| Bank Nifty | 56,592 | -535 Points |
| India VIX | 13.48 | +1.43% |
| GIFT Nifty* | 23,685 | Around -180 Points |
| Brent Crude | $100.60 | ▲ |
| WTI Crude | $92.35 | ▲ |
*GIFT Nifty data as of 23 July 2026, 10:13 PM IST.
Friday's Breakout That Turned Into a Bull Trap
Friday looked like a positive day for the market.
Nifty managed to break above the important 24,400–24,500 resistance zone, which many traders were closely watching. A breakout above such a level generally signals strength and attracts fresh buying.
However, one important rule of technical analysis is that every breakout needs confirmation.
Instead of attracting sustained buying, the market reversed sharply.
This created what traders call a Fake Breakout or Bull Trap—a situation where buyers enter after a breakout, but the price quickly falls back below the breakout level, trapping those who bought late.
This failed breakout became the first warning sign that the market was losing momentum.
Figure 1 – Nifty Technical Analysis
Closed: 23870
Nifty failed to sustain above the 24,400–24,500 resistance zone. The fake breakout was followed by a breakdown below the rising trendline, confirming short-term weakness.
The chart clearly highlights three important developments:
- Breakout above resistance
- Failure to sustain higher levels
- Breakdown below the rising trendline
- Technically, this changed the short-term market structure from bullish to cautious.
Monday's Gap-Down Changed Everything
Over the weekend, major banking companies announced their quarterly earnings.
While some results met expectations, overall market sentiment remained mixed.
On Monday morning, the reaction was immediate.
HDFC Bank opened nearly 5% lower, putting significant pressure on the banking sector.
Since HDFC Bank is one of the largest weighted stocks in both Nifty 50 and Bank Nifty, the sharp decline immediately dragged the broader indices lower.
The gap-down opening also confirmed that Friday's breakout had failed.
What looked like the beginning of a rally quickly turned into a classic bull trap.
Bank Nifty Led the Selling
The banking sector became the biggest contributor to the ongoing correction.
Figure 2 – Bank Nifty Technical Analysis
Closed: 56592
Bank Nifty lost momentum after repeated resistance near 57,600–57,700 and broke below its rising trendline, reflecting weakness after banking earnings.
The Bank Nifty chart shows several important technical developments:
- Multiple rejections near 57,600–57,700
- Breakdown below the rising trendline
- Price currently testing the 56,500–56,600 support zone
Since banking stocks carry the highest weight in the benchmark indices, weakness in Bank Nifty naturally spread across the broader market.
As the banking sector declined, selling pressure also increased in mid-cap and small-cap stocks, resulting in broad-based weakness across sectors.
Rising Crude Oil Added to Market Pressure
Another important factor affecting market sentiment is the sharp rise in crude oil prices.
At the time of writing:
- Brent Crude: $100.60
- WTI Crude: $92.35
India imports a significant portion of its crude oil requirements. Higher oil prices increase concerns around inflation, transportation costs, corporate profitability, and the country's import bill.
While crude oil was not the sole reason for the correction, it certainly added to the cautious mood among investors.
Global Markets Also Remained Weak
Domestic markets were not alone.
Weakness in global markets continued to weigh on investor sentiment, and GIFT Nifty was indicating another weak opening by trading nearly 180 points lower after Indian market hours.
Although GIFT Nifty does not guarantee the next day's opening, traders often use it as an early indicator of overnight global sentiment.
Combined with weak banking stocks and rising crude oil, global cues further strengthened the bearish sentiment.
Key Levels to Watch
From a technical perspective, the market is currently trading near an important support zone around 23,900.
If buyers manage to defend this level, a short-term pullback cannot be ruled out.
However, if the selling pressure continues and this support breaks decisively, the next important levels to watch would be:
Immediate Support
23,800
Next Support
23,650
Major Support
23,300
As always, these levels should be considered technical reference points and not trading recommendations. Price action and confirmation remain the key factors while making market decisions.
What This Correction Teaches Every Trader
Every correction offers valuable lessons.
The recent market decline reminds us that:
- Every breakout needs confirmation before taking aggressive positions.
- Heavyweight banking stocks can quickly change the direction of the broader market.
- Global cues and rising crude oil prices can amplify existing technical weakness.
- Proper risk management is more important than predicting market direction.
- Successful traders follow price action rather than emotions.
Markets move in cycles, and corrections are a natural part of every long-term trend.
Crystal's Market View
The recent weakness in the Indian stock market appears to be the result of multiple bearish factors coming together at the same time. A failed breakout in Nifty, disappointing reactions to banking earnings, weakness in Bank Nifty, higher crude oil prices, and negative global sentiment have collectively influenced market direction over the past four sessions.
From a technical perspective, the 23,800 zone remains an important level to watch. If buyers defend this support and the market starts reclaiming broken levels, sentiment could gradually improve. However, if the index sustains below this support, attention may shift toward the next important zones around 23,650 and 23,300.
Instead of reacting emotionally during volatile phases, traders should focus on confirmation, disciplined risk management, and following price action.
Learn Practical Technical Analysis with Crystal Institute of Stock Market
Understanding concepts like fake breakouts, trendline analysis, support & resistance, market structure, and price action can significantly improve the way you approach trading.
At Crystal Institute of Stock Market, we believe in practical market education through live chart analysis, structured learning, and disciplined trading techniques designed for beginners as well as aspiring traders.
📞 Contact: +91 90817 27056
🌐 Website: www.crystal1.in
Disclaimer
This article is published solely for educational and informational purposes. The views expressed are based on publicly available information, chart analysis, and the author's personal observations. They should not be construed as investment, trading, or financial advice. Financial markets involve risk, and readers should conduct their own research or consult a SEBI-registered investment adviser before making any investment or trading decisions. Crystal Institute of Stock Market and the author shall not be held responsible for any financial losses arising from decisions made based on this article.
why-indian-stock-market-falling