

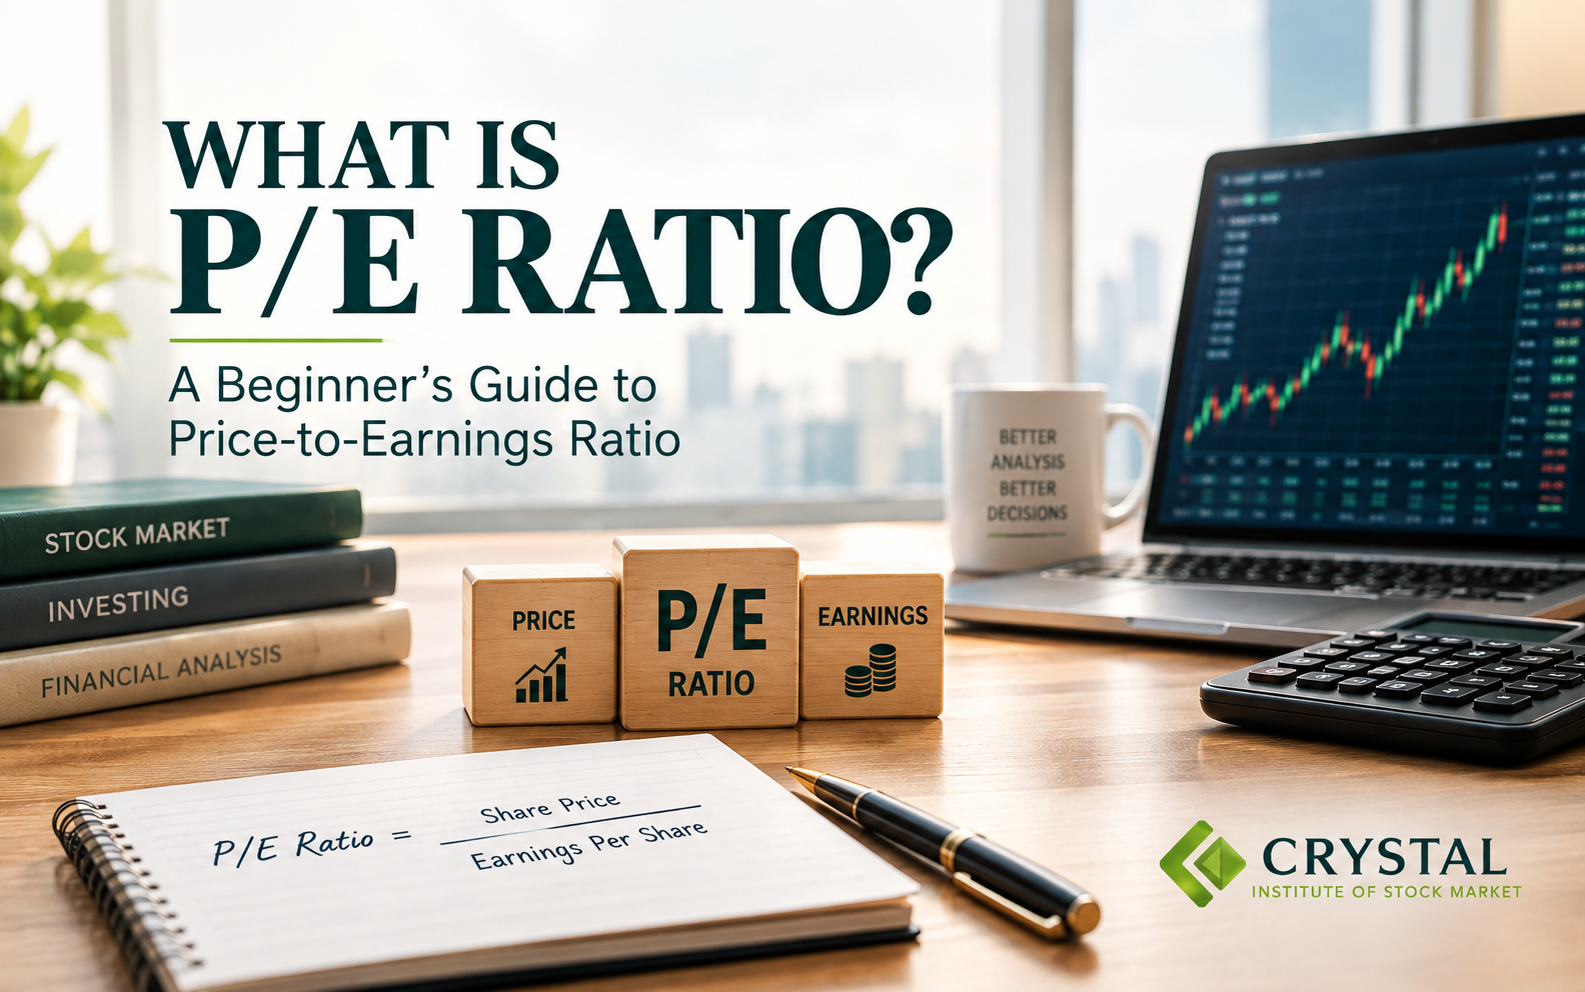
What Is P/E Ratio? A Beginner’s Guide to Price-to-Earnings Ratio
When you start learning about the stock market, you will come across many numbers associated with a company.
Revenue.
Profit.
EPS.
Market Capitalization.
And one number that appears almost everywhere:
P/E Ratio.
You may have seen statements like:
“This stock is trading at a P/E of 25.”
Or:
“The sector average P/E is 18, but this company is trading at 30.”
But what does that actually mean?
Is a P/E of 30 expensive?
Is a P/E of 10 cheap?
And does a low P/E automatically make a stock a good investment?
Not necessarily.
Understanding the P/E ratio properly can help you look at stock valuations more intelligently instead of judging a company simply by its share price.
What Is P/E Ratio?
P/E stands for Price-to-Earnings Ratio.
It compares a company's share price with the earnings generated per share (EPS).
The basic formula is:
P/E Ratio = Share Price ÷ Earnings Per Share (EPS)
For example, suppose a company has:
- Share Price = ₹500
- EPS = ₹25
Then:
P/E = ₹500 ÷ ₹25 = 20
So the company is trading at a P/E ratio of 20.
In simple terms, the P/E ratio tells you how much investors are currently willing to pay for every ₹1 of the company's earnings.
A P/E of 20 means investors are paying approximately ₹20 for every ₹1 of annual earnings per share.
However, this does not mean that you will definitely earn your money back in 20 years. P/E is a valuation ratio, not a guaranteed payback period.
Why Is P/E Ratio Important?
The P/E ratio gives investors a quick way to think about the valuation of a company relative to its current earnings.
For example:
Company A: P/E = 12
Company B: P/E = 30
At first glance, Company A appears cheaper based on earnings.
But that doesn't automatically make Company A better.
Why?
Because investors may be expecting Company B to grow its earnings much faster in the future.
A company with:
- strong earnings growth,
- a powerful business model,
- high return on capital,
- strong competitive advantages,
may sometimes trade at a higher P/E.
On the other hand, a company with a low P/E may have:
- weak growth,
- declining profits,
- high debt,
- cyclical earnings,
- or other business risks.
Therefore:
P/E tells you about valuation. It does not tell you everything about the quality of the business.
How to Calculate P/E Ratio
The calculation is straightforward.
Example
Suppose ABC Ltd has:
Current Share Price: ₹600
EPS: ₹30
P/E Ratio:
₹600 ÷ ₹30 = 20
Therefore, ABC Ltd is trading at a P/E of 20.
Now imagine another company:
Share Price: ₹400
EPS: ₹10
Its P/E would be:
₹400 ÷ ₹10 = 40
Although the second company's share price is lower, its P/E is actually much higher.
This highlights an important point:
Share price alone does not tell you whether a stock is expensive or cheap.
What Does a High P/E Ratio Mean?
A high P/E ratio generally means investors are willing to pay a higher price relative to the company's current earnings.
There can be several reasons for this.
1. Investors expect strong future growth
If investors believe earnings will grow significantly in the future, they may be willing to pay a higher valuation today.
2. The company has a strong business model
Companies with strong brands, competitive advantages, high profitability or strong market positions may command premium valuations.
3. The entire sector is trading at high valuations
Sometimes an entire industry trades at a higher P/E because investors expect strong growth from that sector.
4. The stock may simply be expensive
A high P/E is not always justified.
If earnings don't grow enough to support the valuation, the stock can eventually experience a valuation correction.
So:
High P/E ≠ Bad Stock
But also:
High P/E ≠ Good Stock
You need to understand why the P/E is high.
What Does a Low P/E Ratio Mean?
A low P/E ratio means the share price is relatively low compared with the company's current earnings.
At first glance, this can look attractive.
But there may be a reason.
For example, a company could have a low P/E because:
- its earnings are expected to decline,
- the industry is facing difficulties,
- the company has high debt,
- profits are temporarily elevated,
- investors have concerns about future growth,
- or the business is cyclical.
This is why blindly searching for the lowest P/E stocks can be dangerous.
A low P/E stock is not automatically an undervalued stock.
Sometimes it is simply a company whose future earnings are expected to be weaker.
High P/E vs Low P/E
Here's a simple way to think about it:
| P/E | What It May Indicate |
|---|---|
| Low P/E | Lower valuation relative to current earnings |
| High P/E | Higher valuation relative to current earnings |
| Very Low P/E | Could be undervalued — or could signal business concerns |
| Very High P/E | Could reflect strong growth expectations — or excessive optimism |
The key word is “may.”
P/E should be interpreted in context.
Should You Compare P/E Ratios Across Different Sectors?
This is one of the most important points for beginners.
Usually, P/E comparisons are more meaningful within the same industry or sector.
For example, comparing the P/E ratios of two similar companies can be useful.
But comparing a technology company with a bank purely based on P/E can be misleading.
Different industries have different:
- growth rates,
- capital requirements,
- profitability,
- business cycles,
- risk levels,
- accounting characteristics.
Therefore, instead of asking:
“Which stock has the lowest P/E?”
A better question is:
“How does this company's P/E compare with similar companies and its own historical valuation?”
What Is Trailing P/E?
Trailing P/E uses the company's earnings from the previous 12 months.
It is based on actual reported earnings.
For example:
If a company earned ₹20 per share over the last twelve months and its current share price is ₹400:
Trailing P/E = ₹400 ÷ ₹20 = 20
The advantage is that it uses actual earnings.
The limitation is that those earnings are from the past.
What Is Forward P/E?
Forward P/E uses estimated future earnings rather than historical earnings.
For example, suppose:
Current Share Price = ₹500
Expected EPS for the coming year = ₹25
Then:
Forward P/E = ₹500 ÷ ₹25 = 20
Forward P/E can be useful because stock prices are influenced by expectations about the future.
However, future earnings are estimates.
And estimates can be wrong.
Therefore, forward P/E should be treated as an expectation, not a certainty.
Why Can Two Companies Have Different P/E Ratios?
Consider two companies operating in the same industry.
Company A
P/E = 15
Expected earnings growth = 5%
Company B
P/E = 30
Expected earnings growth = 20%
Company B looks much more expensive based purely on P/E.
But investors may be paying a premium because they expect its earnings to grow significantly faster.
This is why valuation should always be considered alongside earnings growth and business quality.
P/E Ratio and Earnings Growth
One of the most important relationships in stock valuation is:
Valuation + Growth
A company trading at a high P/E may justify that valuation if its earnings grow strongly over time.
But if earnings fail to grow as expected, the valuation can become difficult to justify.
For example:
A stock trading at P/E 40 may look expensive today.
But if its earnings grow rapidly for several years, the P/E can gradually become more reasonable.
On the other hand, a stock trading at P/E 12 may look cheap.
But if earnings continuously decline, the stock may not actually be undervalued.
This is why investors should avoid looking at P/E in isolation.
Can a Low P/E Stock Fall Further?
Absolutely.
This is a common mistake among beginners.
Some investors assume:
“The P/E is already low, so the stock cannot fall much.”
There is no such guarantee.
If a company's earnings decline, its valuation can remain unattractive even after a price fall.
For example:
Share Price = ₹300
EPS = ₹25
P/E = 12
If earnings fall to ₹15 while the share price remains ₹300:
P/E = 20
The stock has not become cheaper based on earnings.
This is why you need to monitor both:
Price + Earnings
What Are the Limitations of P/E Ratio?
P/E is useful, but it is not a complete valuation tool.
1. It depends on earnings
If earnings are temporarily unusually high or low, the P/E can give a misleading picture.
2. It may not work well for loss-making companies
If a company has negative earnings, its P/E may not be meaningful.
3. It doesn't measure debt directly
Two companies can have similar P/E ratios but very different debt levels.
4. It doesn't tell you about future growth
P/E is based on earnings, but the stock market also prices future expectations.
5. Different sectors have different normal valuations
A P/E considered high in one industry may not be unusual in another.
6. Accounting earnings can change
Reported earnings can be affected by accounting factors, exceptional items and other circumstances.
Therefore, P/E should be treated as one part of analysis, not the entire analysis.
What Should You Check Along With P/E?
Instead of looking at only one number, consider the bigger picture.
A basic checklist can include:
Business Quality
- What does the company actually do?
- Does it have a sustainable competitive advantage?
- Is its business model understandable?
Earnings
- Are profits growing?
- Are earnings consistent?
- Are margins improving or declining?
Debt
- Does the company have manageable debt?
- Is interest expense becoming a concern?
Valuation
- What is the current P/E?
- What has been its historical P/E?
- How does it compare with similar companies?
Growth
- What is the expected earnings growth?
- Is the current valuation reasonable compared with that growth?
Cash Flow
- Are reported profits converting into actual cash generation?
This gives you a much more complete picture than P/E alone.
P/E Ratio vs Market Capitalization
These two concepts are often confused.
Market Capitalization tells you about the size of a company in the stock market.
P/E Ratio tells you about the relationship between its share price and earnings.
For example:
A company can have a very large market capitalization but trade at a relatively low P/E.
Another smaller company can have a much higher P/E.
So:
Market Cap = Company Size
P/E = Valuation Relative to Earnings
Understanding both concepts helps investors read company information more intelligently.
A Simple Way to Think About P/E
Imagine two shops.
Shop A earns ₹10 lakh per year and someone is willing to pay ₹1 crore to buy it.
Shop B also earns ₹10 lakh per year but someone is willing to pay ₹3 crore.
The second shop is being valued much more highly relative to its current earnings.
The stock market works with a similar concept.
The difference is that listed companies can have very different expectations about their future earnings, growth and business prospects.
That's why simply saying:
“Lower P/E is better.”
is an incomplete way of thinking.
Common P/E Mistakes Beginners Should Avoid
Mistake 1: Buying the lowest P/E stock
Cheap-looking does not always mean undervalued.
Mistake 2: Assuming high P/E means the stock will fall
A high P/E can sometimes reflect strong expected growth.
Mistake 3: Comparing unrelated sectors
Sector differences matter.
Mistake 4: Ignoring earnings growth
Today's P/E may look expensive if you ignore tomorrow's earnings.
Mistake 5: Looking at P/E without checking debt and cash flow
Valuation should be considered alongside financial strength.
Mistake 6: Treating P/E as a buy or sell signal
P/E is an analytical metric, not a standalone trading signal.
Final Thoughts
The P/E ratio is one of the most useful numbers for understanding stock valuation, especially when you are comparing companies within the same industry.
But the real skill is not simply knowing whether a P/E is high or low.
The real question is:
“Is the current valuation reasonable compared with the company's earnings, growth, business quality and future expectations?”
A low P/E can represent an opportunity.
It can also represent a business facing problems.
A high P/E can represent an expensive stock.
It can also represent a company with strong growth expectations.
Therefore, don't use P/E as a shortcut.
Use it as one piece of the larger investment-analysis puzzle.
The more you understand the relationship between price, earnings, growth and valuation, the better you can evaluate a company beyond simply looking at its share price.
Continue Learning
If you are building your stock market fundamentals step by step, continue with:
What Is Market Capitalization? Large Cap, Mid Cap & Small Cap Explained
How Does the Stock Market Actually Work? A Beginner’s Guide
Demat Account vs Trading Account: What’s the Difference?
Why Is Risk Management Important in Trading?
Introduction to Price Action Trading
Disclaimer
This article is published for educational and informational purposes only. It is not investment advice, a recommendation, stock tip, buy/sell call, or a guarantee of profits.
Stock market investments are subject to market risks. Readers should conduct their own research and consult a qualified financial professional before making investment decisions.
What Is P/E Ratio? Meaning, Formula & How to Use It
Learn what P/E ratio means, how to calculate it, and how to understand high and low P/E ratios when analyzing stocks and company valuations.
- P/E ratio meaning
- what is P/E ratio
- price to earnings ratio
- P/E ratio formula
- how to calculate P/E ratio
- high P/E vs low P/E
- P/E ratio in stock market
- P/E ratio explained
- stock valuation
- trailing P/E
- forward P/E
- P/E ratio for beginners
what-is-pe-ratio-price-to-earnings
P/E Ratio, Price to Earnings Ratio, Stock Valuation, Fundamental Analysis, Stock Market Basics, Investing Basics, Indian Stock Market, Trading Basics