

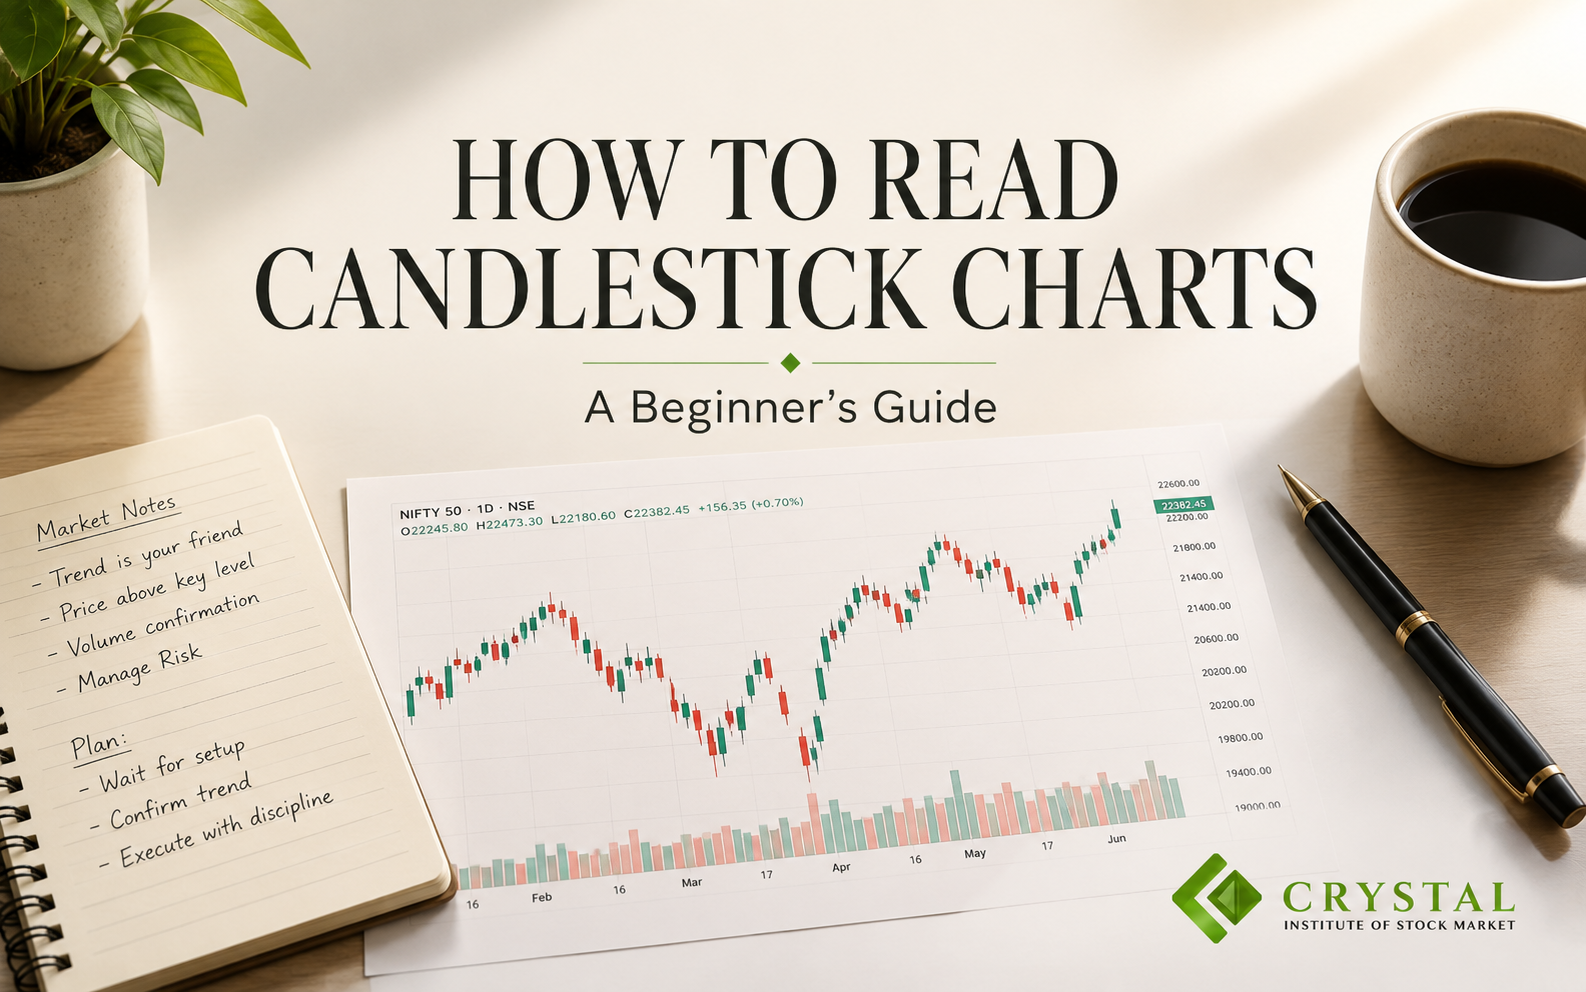
How to Read Candlestick Charts: A Beginner's Step-by-Step Guide
If you've recently started learning about the stock market, you've probably heard traders discussing candlestick charts. Every trading platform, from TradingView to broker terminals, displays price movements using candlesticks because they provide a quick and effective way to understand market behaviour.
The good news is that reading candlestick charts is much easier than it appears.
In this guide, you'll learn what a candlestick is, how to read it, and why it plays such an important role in technical analysis.
What Is a Candlestick Chart?
A candlestick chart is a visual representation of a stock's price movement during a specific period. Every candlestick tells the story of the battle between buyers and sellers.
Whether you're looking at a 5-minute chart, a 15-minute chart, an hourly chart, or a daily chart, each candlestick represents four important prices:
- Opening Price
- Highest Price
- Lowest Price
- Closing Price
These four prices help traders understand market sentiment and identify potential trading opportunities.
Understanding the Structure of a Candlestick
Every candlestick has two main parts.
The Body
The body represents the difference between the opening price and the closing price.
If the stock closes above its opening price, it forms a bullish candle, showing that buyers were stronger during that session.
If the stock closes below its opening price, it forms a bearish candle, indicating that sellers had control.
The Wicks (Shadows)
The thin lines above and below the body are called wicks or shadows.
- The upper wick shows the highest price reached during that period.
- The lower wick shows the lowest price reached.
Long wicks often indicate rejection of higher or lower prices and can provide valuable clues about market sentiment.
Bullish vs Bearish Candles
A bullish candle generally reflects buying strength and positive sentiment.
A bearish candle suggests that selling pressure dominated during the trading session.
However, it's important to remember that a single candle rarely tells the complete story. Experienced traders always analyse candlesticks along with trend, support and resistance, volume, and overall market structure before making a trading decision.
Why Are Candlestick Charts Important?
Candlestick charts help traders:
- Understand buyer and seller psychology.
- Identify market momentum.
- Spot potential reversals.
- Recognise support and resistance reactions.
- Improve trade entries and exits.
This is why candlestick analysis forms the foundation of technical analysis and price action trading.
A Simple Example
Imagine a stock opens at ₹100.
During the day, it rises to ₹108, falls to ₹98, and finally closes at ₹106.
From just one candlestick, we can understand that:
- Buyers managed to close the price above the opening level.
- Sellers pushed prices lower during the session but failed to maintain control.
- Buying interest returned before the market closed.
Instead of only looking at the closing price, a candlestick tells the complete story of what happened throughout the trading session.
Common Mistakes Beginners Make
Many new traders repeat the same mistakes while learning candlestick charts.
Some of the most common ones are:
- Taking trades based on a single candle.
- Ignoring the overall market trend.
- Trading without waiting for confirmation.
- Overlooking important support and resistance levels.
- Memorising patterns without understanding market context.
Learning to read candlesticks is important, but combining them with proper risk management and market structure is what makes the difference.
Tips for Beginners
If you're just starting your trading journey, keep these simple tips in mind:
- Learn to read price before relying on indicators.
- Observe charts daily, even if you don't trade.
- Practice on historical charts to build confidence.
- Focus on understanding market behaviour instead of predicting every move.
- Be patient—consistency is more valuable than speed.
Key Takeaways
- A candlestick represents the opening, high, low, and closing prices of a stock during a specific time period.
- The body shows the relationship between the opening and closing price.
- Wicks indicate the highest and lowest prices reached during the session.
- Candlestick charts help traders understand market psychology and price action.
- Never rely on a single candle to make trading decisions. Always analyse the broader market context.
Final Thoughts
Learning to read candlestick charts is one of the first milestones in every trader's journey. While candlesticks provide valuable insights into market sentiment, they should never be used in isolation.
Professional traders don't make decisions based on a single candle. They analyse the overall trend, support and resistance levels, market structure, volume, and risk before entering a trade.
As a beginner, don't focus on memorising dozens of candlestick patterns overnight. Instead, spend time understanding what each candle is trying to communicate. With regular observation and practice, you'll gradually develop the ability to read price action with confidence.
Remember, successful trading is not about predicting the market—it's about understanding probabilities and managing risk effectively.
Crystal Insight 💎
At Crystal Institute of Stock Market, we believe that every successful trader starts with a strong foundation.
Candlestick charts are not a shortcut to profits—they are a language. Once you learn to read that language, you'll begin to understand what buyers and sellers are communicating through price movements.
Before moving to advanced indicators or trading strategies, make sure your basics are strong. A solid foundation will always outperform shortcuts in the long run.
Frequently Asked Questions (FAQs)
Can I trade using only candlestick charts?
Candlestick charts are a powerful tool, but they should be used along with trend analysis, support and resistance, volume, and proper risk management rather than in isolation.
Which timeframe is best for beginners?
Many beginners start by analysing daily charts because they provide a clearer picture and contain less market noise than very short timeframes.
Are candlestick patterns always accurate?
No. Candlestick patterns indicate probabilities, not guarantees. They work best when combined with other technical analysis concepts.
How long does it take to learn candlestick charts?
The basics can be understood in a few days, but becoming confident in reading market behaviour requires regular observation, practice, and experience.
Continue Your Learning Journey
If you found this guide helpful, continue building your stock market knowledge with these beginner-friendly articles:
📘 How Does the Stock Market Actually Work?
📘 Demat Account vs Trading Account: What's the Difference?
📘 What Is Technical Analysis?
📘 Support & Resistance Explained
Each article is designed to help you build your understanding step by step and become a more informed market participant.
Learn with Crystal Institute of Stock Market
Whether you're completely new to the stock market or looking to improve your trading skills, Crystal Institute of Stock Market offers structured classroom training designed to simplify the markets through practical learning, live examples, and real-world concepts.
If you're serious about building a strong foundation in trading and investing, we're here to help you begin your journey with confidence.
🌐 Website: www.crystal1.in
📞 Contact: +91 90817 27056
📍 Offline Classroom Training – Surat, Gujarat
Disclaimer
This article is published for educational and informational purposes only and should not be considered investment, financial, or trading advice. Trading and investing in the stock market involve market risks. Readers should conduct their own research or consult a SEBI-registered investment adviser before making any investment decisions.
how-to-read-candlestick-charts
How to Read Candlestick Charts
andlestick Charts, Technical Analysis, Trading Basics, Price Action, Candlestick Patterns, Stock Market for Beginners, Learn Trading, Indian Stock Market, Crystal Institute of Stock Market